The “Finding Data” section in this page was adapted from the Long Term Ecological Research (LTER) Network’s course “Synthesis Skills for Early Career Researchers” (SSECR). Those materials can be found at lter.github.io/ssecr
1 The Big Idea
The ultimate goal of this lesson is to provide an overview of a reproducible open science framework for your research, applicable both when you are accessing published data as a data user – for example, to use it for synthesis – and when you want to publish your own data as a data author. To achieve this, we are going to talk about the following topics.
- The Data Life Cycle
- The importance of data management
- Metadata best practices
- Data preservation
We will discuss how these topics relate to each other and why they are the building block for you to use others’ data and for others to access, interpret, and use your data in the future.
2 The Data Life Cycle
The Data Life Cycle gives you an overview of meaningful steps in a research project. This step-by-step breakdown facilitates successful management and preservation of data throughout a project. Some research activities might use only part of the life cycle. For example, a meta-analysis might focus on the Discover, Integrate, and Analyze steps, while a project focused on primary data collection and analysis might bypass the Discover and Integrate steps.
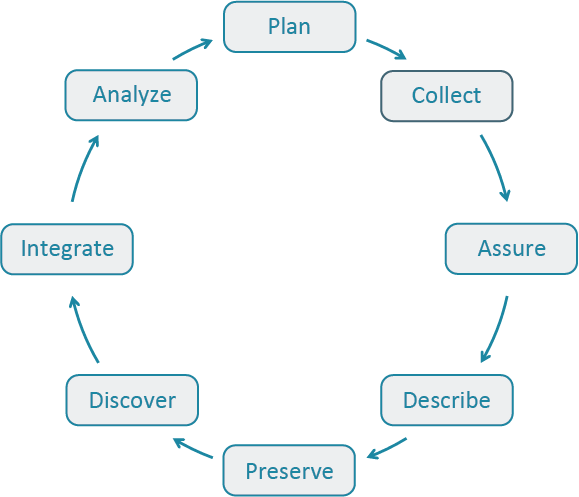
The first step to working with data is identifying where your project is starting in the Data Life Cycle. Using the data life cycle stages, create your own cycle that best fits your project needs.
A way to use the Data Life Cycle in practice is to:
- Think about the end goal, outcomes, and products of your project
- Think and decide steps in the Data Life Cycle you need to include in your project
- Review DataONE’s best practices for that step in the cycle and start outlining action items in each of those steps.
DataONE’s Data Management Skillbuilding Hub offers several best practices on how to effectively work with your data throughout all stages of the data life cycle.
No matter how your data life cycle looks like, Plan should be at the top of the cycle. It is advisable to initiate your data management planning at the beginning of your research process before any data has been collected or discovered. The following section will discuss more in-depth data management and how to plan accordingly
3 Data Workflows
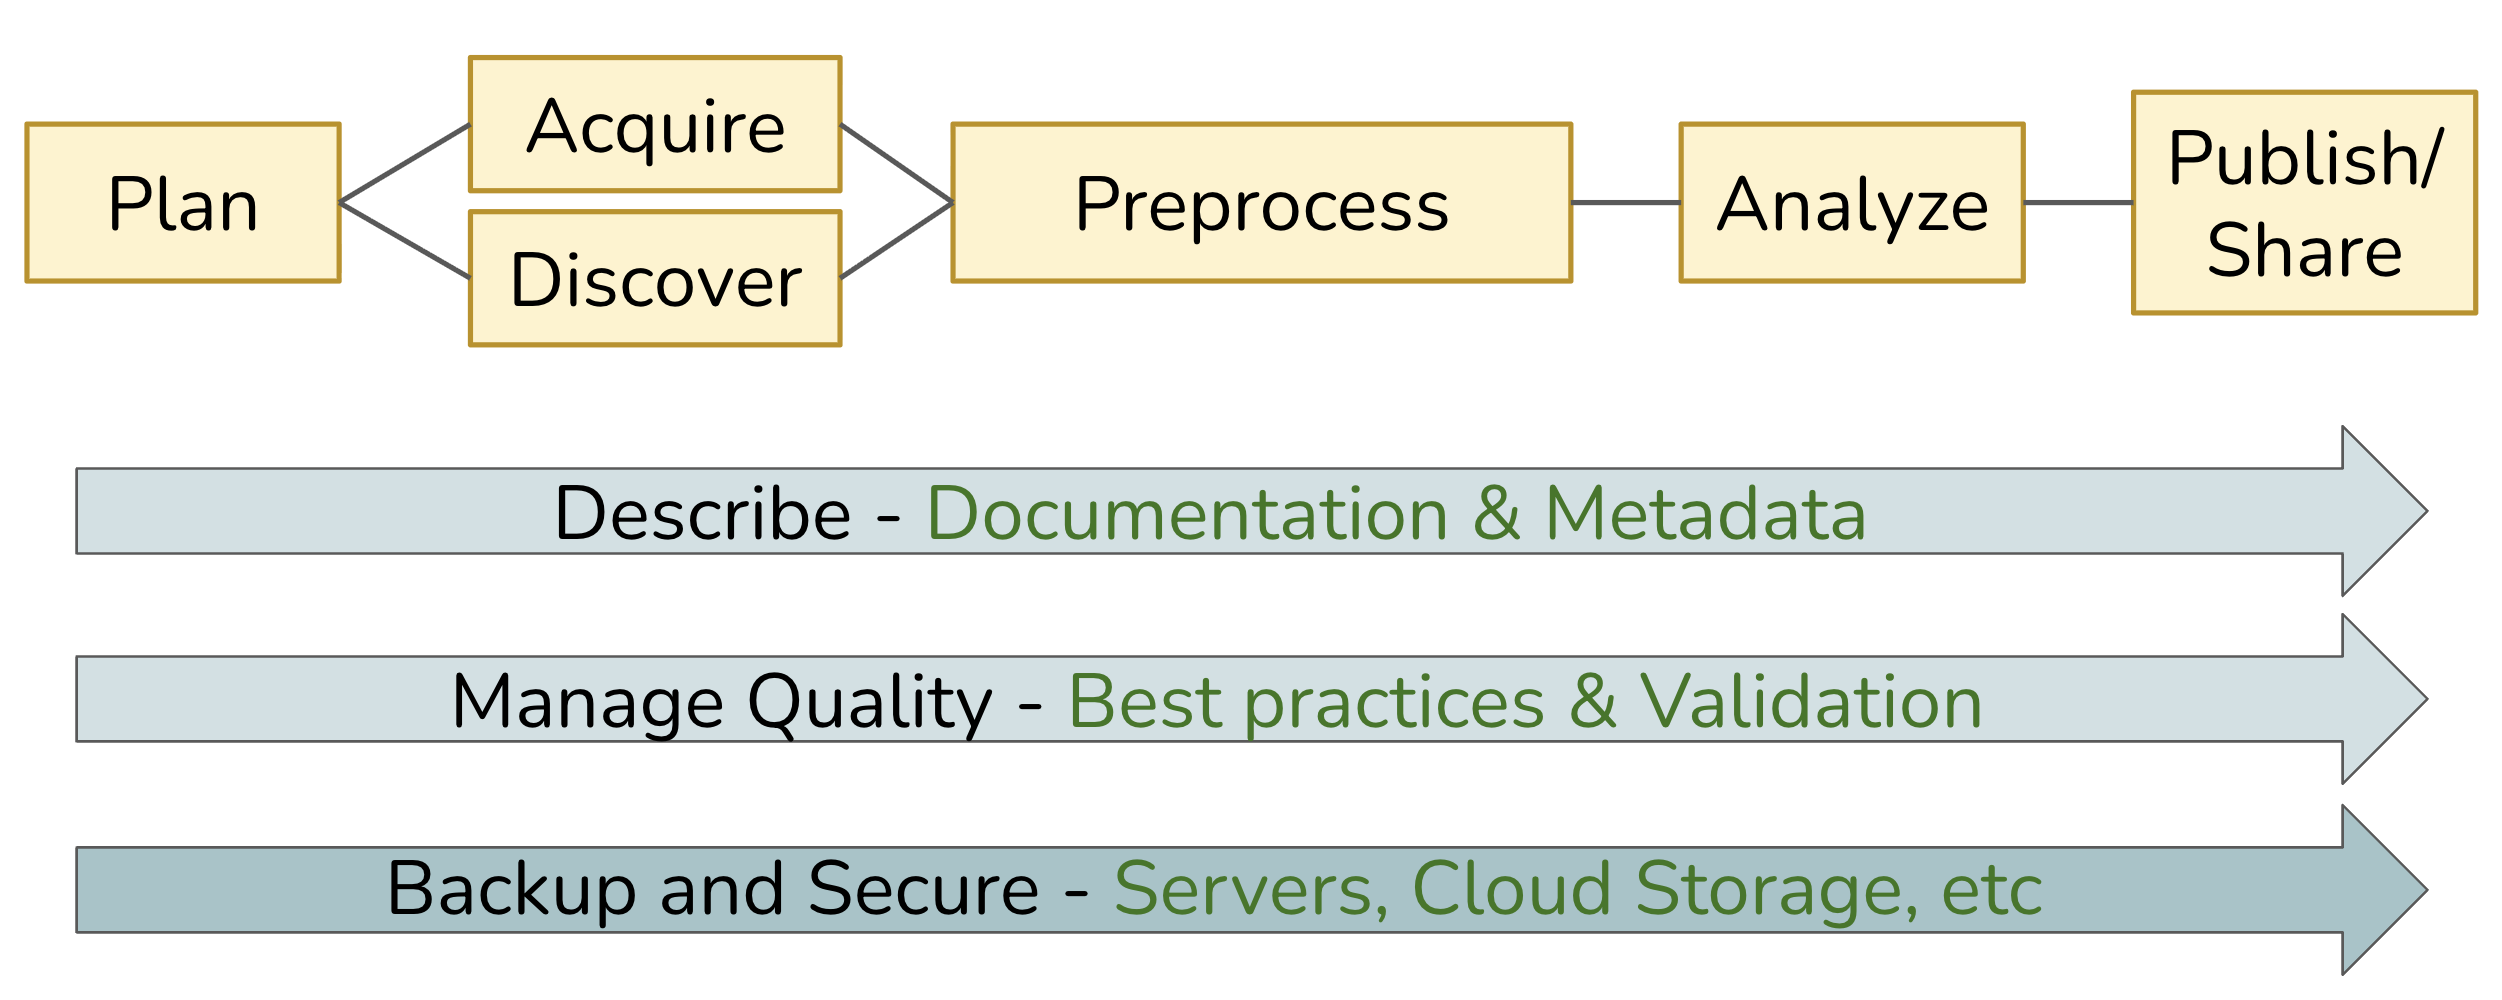
Whereas the Data Life Cycle provides a strategic perspective on how to manage data over its full lifespan, a Data Workflow focuses on the operational process of acquiring data in some raw state, transforming it via a series of steps, and ultimately producing one or more derived research products. The diagram below depicts a generalized workflow that tends to be applicable to most projects involving data, although each project is unique in terms of the details underlying each step.
In the ideal case, this workflow can be fully automated, from the acquisition of raw data to the production of derived outputs (including analytical results, model predictions, visualizations, and more). Imagine being able to run this on-demand as a repeatable process, effectively enabling a pipeline in which data is “moved” from its starting point through a series of transformations performed by executable code, yielding whatever final outputs are desired. In practice, we often can’t achieve full automation, but our goal should be to come as close as we can.
Across the entire workflow, three additional elements are key to ensuring that the pipeline is robust, reliable, and repeatable:
- Describe: Thorough documentation and metadata detailing each step, and its inputs and outputs; well-written and documented code itself is hugely beneficial!
- Manage Quality: Use well-vetted tools and technology, and build validation steps into the process.
- Backup and Secure: Adopt practices and services that provide redundant storage and version control, with sufficient assurances around data integrity and security.
4 Finding Data
4.1 Useful Data Repositories
There are a lot of specialized data repositories out there. These organizations are either primarily dedicated to storing and managing data or those operations constitute a substantive proportion of their efforts. In synthesis work, you may already have some datasets in-hand at the outset but it likely that you will need to find more data to test your hypotheses. Data repositories are a great way of finding/accessing data that are relevant to your questions.
You’ll become familiar with many of these when you need a particular type of data and go searching for it but to help speed you along, see the list below for a non-exhaustive set of some that have proved useful to other synthesis projects in the past. They are in alphabetical order. If the “ Package” column contains the GitHub logo () then the package is available on GitHub but is not available on CRAN (or not available at time of writing).
| Name | Description | Package |
|---|---|---|
| AmeriFlux | Provides data on carbon, water, and energy fluxes in ecosystems across the Americas, aiding in climate change and carbon cycle research. | amerifluxr |
| DataONE | Aggregates environmental and ecological data from global sources, focusing on biodiversity, climate, and ecosystem research. | dataone |
| EDI | Contains a wide range of ecological and environmental datasets, including long-term observational data, experimental results, and field studies from diverse ecosystems. | EDIutils |
| EES-DIVE | The Environmental System Science Data Infrastructure for a Virtual Ecosystem (ESS-DIVE) includes a variety of observational, experimental, modeling and other data products from a wide range of ecological and urban systems. | – |
| GBIF | The Global Biodiversity Information Facility (GBIF) aggregates global species occurrence data and biodiversity records, supporting research in species distribution and conservation. | rgbif |
| Google Earth Engine | Google Earth Engine is a cloud-based geospatial analysis platform that provides access to vast amounts of satellite imagery and environmental data for monitoring and understanding changes in the Earth’s surface. | rgee |
| Microsoft Planetary Computer | The Microsoft Planetary Computer is a cloud-based platform that combines global environmental datasets with advanced analytical tools to support sustainability and ecological research. | rstac |
| NASA | Provides data on earth science, space exploration, and climate, including satellite imagery and observational data for both terrestrial and extraterrestrial studies. Nice GUI-based data download via AppEEARS. | nasadata |
| NCBI | Hosts genomic and biological data, including DNA, RNA, and protein sequences, supporting genomics and molecular biology research. | rentrez |
| NEON | Provides ecological data from U.S. field sites, covering biodiversity, ecosystems, and environmental changes, supporting large-scale ecological research. | neonUtilities |
| NOAA | Offers meteorological, oceanographic, and climate data, essential for understanding atmospheric conditions, marine environments, and long-term climate trends. | EpiNOAA-R |
| Open Traits Network | While not a repository per se, the Open Traits Network has compiled an extensive lists of repositories for trait data. Check out their repository inventory for trait data | – |
| USGS | Hosts data on geology, hydrology, biology, and geography, including topographical maps and natural resource assessments. | dataRetrieval |
4.2 General Data Searches
If you don’t find what you’re looking for in a particular data repository (or want to look for data not included in one of those platforms), you might want to consider a broader search. For instance, Google is a surprisingly good resource for finding data and–for those familiar with Google Scholar for peer reviewed literature-specific Googling–there is a dataset-specific variant of Google called Google Dataset Search.
4.3 Search Operators
Virtually all search engines support “operators” to create more effective queries (i.e., search parameters). If you don’t use operators, most systems will just return results that have any of the words in your search which is non-ideal, especially when you’re looking for very specific criteria in candidate datasets.
See the tabs below for some useful operators that might help narrow your dataset search even when using more general platforms.
Use quotation marks ("") to search for an exact phrase. This is particularly useful when you need specific data points or exact wording.
Example: "reef biodiversity"
Use an asterisk (*) to search using a placeholder for any word or phrase in the query. This is useful for finding variations of a term.
Example: Pinus * data
Use a plus sign (+) to search using more than one query at the same time. This is useful when you need combinations of criteria to be met.
Example: bat + cactus
Use the ‘or’ operator (OR) operator to search for either one term or another. It broadens your search to include multiple terms.
Example: "prairie pollinator" OR "grassland pollinator"
Use a minus sign (-; a.k.a. “hyphen”) to exclude certain words from your search. Useful to filter out irrelevant results.
Example: marine biodiversity data -fishery
Use the site operator (site:) to search within a specific website or domain. This is helpful when you’re looking for data from a particular source.
Example: site:.gov bird data
Use the file type operator (filetype:) to search for data with a specific file extension. Useful to make sure the data you find is already in a format you can interact with.
Example: filetype:tif precipitation data
Use the ‘in title’ operator (intitle:) to search for pages that have a specific word in the title. This can narrow down your results to more relevant pages.
Example: intitle:"lithology"
Use the ‘in URL’ operator (inurl:) to search for pages that have a specific word in the URL. This can help locate data repositories or specific datasets.
Example: inurl:data soil chemistry
5 Making a Data Inventory
As you find data, it will become necessary to–somehow–record what data your group has on hand. A data inventory is an extremely useful tool in this effort! A data inventory can take many forms but at its simplest, it should be a table where each dataset you find gets one row and critical information about that dataset is recorded in each column. It can be difficult to know which columns to include but keep in mind that it is always easiest to record information that you don’t wind up using than it is to go hunt through all of your datasets for some piece of information you didn’t record in the first place.
We’ve grouped some recommendations for useful data inventory components below into some loose categories but these are guidelines and your team likely will come up with useful additions–or may not need some of these pieces of information!
First and foremost, you’ll want to record where you found the data and where you can find it again if needed.
- What is the URL to the data?
- When did you last download or otherwise receive the data?
- Who owns the data (either a person or an institution)?
- What is the contact info for the data owner?
- What is the name of the data file when you originally download it?
- Is there a paper or report that may provide context that isn’t included in the official metadata? If so, what’s the link/citation info for that document?
- Sometimes a peer-reviewed paper’s Methods section might include valuable context that isn’t actually included in the data!
- If the data have a license, how are you allowed to use the data? How must you cite the data owner/data maintainer?
Sometimes a data inventory can be a useful source of explanatory variables for your analysis!
- What are the coordinates (i.e., latitude & longitude) of the data?
- Remember to enter these in decimal degrees if you want to use them in analysis!
- What country/state/county/locality is the data from?
- Include all of these that might vary across your datasets!
- What habitat or ecosystem is the data from?
- What’s the focal taxonomic group?
- What’s the taxonomic granularity?
- I.e., is there information about different species or only at a higher level?
- Are the data experimental or observational?
- If experimental, what treatments were applied? When? How frequently?
- What is the time range of the data?
- What is the temporal granularity of the data?
- Relatedly, what are the first and last years/time points in the data?
- How big was the study area/experimental plot?
If you start relying on a data inventory, it can become a valuable place to assign or delegate tasks within your group. This can also be helpful at the end of the project when you’re trying to remember who deserves credit for finding data/metadata.
- Who–in your group–is responsible for filling out the other columns in the data?
- I.e., whose ‘homework’ is it to flesh out this row of the data inventory?
- Who is responsible for double-checking the metadata entered by the first team member?
- Who is the primary point of contact with the original data owner/maintainer?
One critical use of a data inventory that is often overlooked: are the data useful to your question?
If you found the data before, your later data searches will likely also turn it up even if it’s not useful! You can save other group members’ a headache by noting not applicable data so they can disregard it from their searches.
If a particular dataset is not useful, why is it not useful? If your questions or in/exclusion criteria evolve, maybe it will become useful later!
6 Managing Your Data
Successfully managing your data throughout a research project helps ensures its preservation for future use.
6.1 Why Manage Your Data?
These practices help you stay organized, protect your work, and keep your science reproducible (or at least traceable) and defensible over time.
- Keep yourself organized. Develop a consistent system for naming, storing, and retrieving files (data inputs, analytic scripts, outputs at various stages) so you’re don’t lose things later.
- Build reproducibility into your research process. Prefer coded workflows, and carefully document your work, so you can match any output to the exact inputs and transformations that produced it, whether days or years later.
- Control versions of your data. Maintain a clear versioning system so you can identify what changed, when, and why – and confidently purge outdated files without fear.
- Quality control your data more efficiently. Structured data management makes it easier to spot errors, inconsistencies, and gaps early on, before they propagate through your analysis.
- Protect against data loss. Implement regular backups and redundant storage so that hardware failure, accidental deletion, or software corruption doesn’t cost you irreplaceable work.
- Format your data for re-use. Use open, well-documented formats and structures that will still be readable and usable years from now, by you or anyone else.
- Document your data proactively. Write documentation while the details are fresh, not after; your future self will not remember why that variable was coded that way.
- Build credibility through transparency. Well-managed, shareable data signals rigor and invites constructive scrutiny.
These practices support efficiency, consistency, and shared accountability across contributor.
- Standardize naming conventions, formats, and folder structures. What seems obvious to one collaborator may be opaque to another.
- Agree on a merge/integration protocol. When combining datasets from different sources or institutions, document how conflicts, mismatches, and duplicates were resolved.
- Maintain a clear data provenance log. In multi-contributor contexts, it must always be traceable which person/pipeline produced which dataset or transformation.
- Define a single source of truth. Avoid the confusion and errors that can occur when multiple “current” versions of a dataset circulate simultaneously across collaborators.
- Ensure all collaborators have access to shared data. Designate a shared repository or platform that every team member can reach, so no one is working from a stale local copy or blocked from the data they need to contribute effectively.
- Prefer shared, version-controlled repositories. Avoid email attachments. This is where collaborative data management most visibly breaks down in practice.
- Establish shared data governance early. Agree on who owns, can modify, and can release data.
- Coordinate on embargo and publication timing. Clarify who can publish what, and when, to avoid disputes over priority or premature release.
- Plan for contributor turnover. Over time, some collaborators may come and go; documentation and handoff protocols protect the group’s work.
These practices protect the long-term value, integrity, and accessibility of data as a shared scientific resource.
- Treat data as the valuable asset it is. Data is expensive and time-consuming to collect; poor management squanders that investment and may make the work unrepeatable.
- Maximize the utility of existing data. Well-managed data can be reanalyzed, combined with new datasets, and repurposed for questions beyond the original study, extending its scientific return.
- Continually improve data quality. Establish practices that support accuracy, integrity, consistency, and timeliness from the point of capture through to publication and archiving.
- Ensure data is used appropriately. Clear documentation of provenance, consent, and access restrictions helps prevent misuse and protects both participants and researchers.
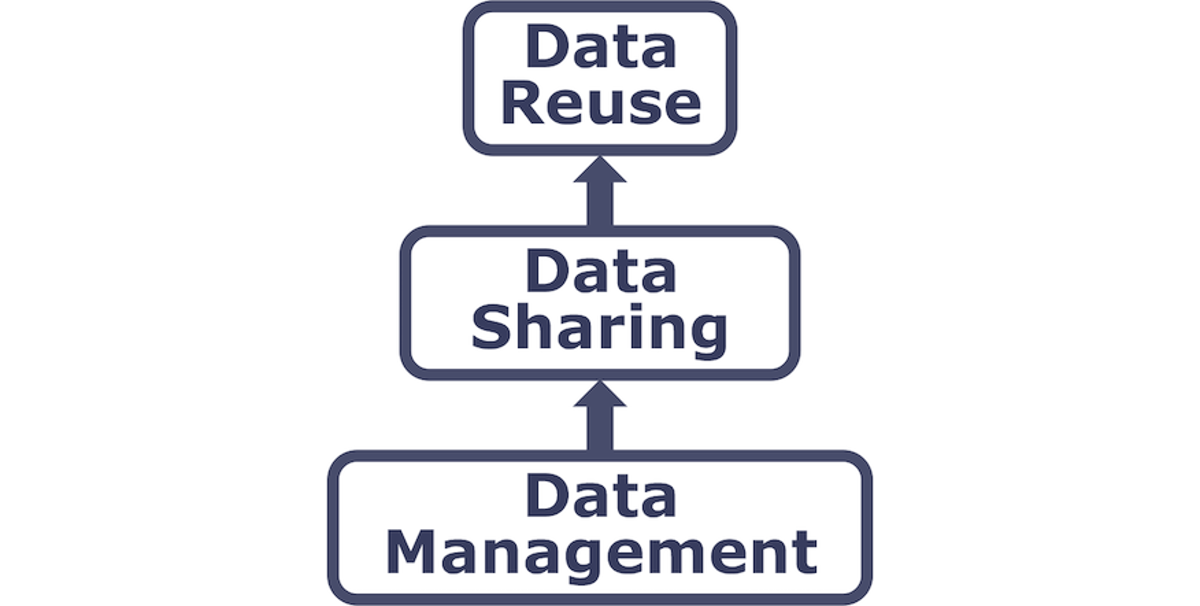
- Facilitate data sharing. Data that is well-organized, documented, and formatted is far more likely to actually be shared and used; good management is what makes sharing feasible, not just aspirational.
- Ensure long-term sustainability and accessibility. Archive data in formats and repositories that will remain accessible as technology changes, so future researchers can build on your work rather than starting from scratch.
6.2 Tools to Manage your Data
A Data Management Plan (DMP) is a document that describes how you will use your data during a research project, as well as what you will do with your data long after the project ends. DMPs are living documents and should be updated as research plans change to ensure new data management practices are captured (Environmental Data Initiative).
A well-thought-out plan means you are more likely to:
- Stay organized
- Work efficiently
- Truly share data
- Engage your team
- Meet funder requirements
- DMPs are becoming common in the submission process for proposals
A DMP is both a straightforward blueprint for how you manage your data, and provides guidelines for your and your team on policies, access, roles, and more. While it is important to plan, it is equally important to recognize that no plan is perfect as change is inevitable. To make your DMP as robust as possible, treat it as a “living document” that you periodically review with your team and adjust as the needs of the project change.
6.3 How to Plan
- Plan early: research shows that over time, information is lost and this is inevitable so it’s important to think about long-term plans for your research at the beginning before you’re deep in your project. And ultimately, you’ll save more time.
- Plan in collaboration: high engagement of your team and other important contributors is not only a benefit to your project, but it also makes your DMP more resilient. When you include diverse expertise and perspectives to the planning stages, you’re more likely to overcome obstacles in the future.
- Utilize existing resources: don’t reinvent the wheel! There are many great DMP resources out there. Consider the article Ten Simple Rules for Creating a Good Data Management Plan (Michener 2015), which has succinct guidelines on what to include in a DMP. Or use an online tool like DMPTool, which provides official DMP templates from funders like NSF, example answers, and allows for collaboration.
- Make revising part of the process: Don’t let your DMP collect dust after your initially write it. Make revising the DMP part of your research project and use it as a guide to ensure you’re keeping on track.
- Include tidy and ethical lenses: It is important to start thinking through these lenses during the planning process of your DMP, it will make it easier to include and maintain tidy and ethical principles throughout the entire project. We will discuss in depth about tidy data and FAIR principles and we can point you to some useful resources on data ethics though the CARE principles.
7 Metadata Best Practices
Within the data life cycle you can be collecting data (creating new data) or integrating data that has all ready been collected. Either way, metadata plays plays a major role to successfully spin around the cycle because it enables data reuse long after the original collection.
Imagine that you’re writing your metadata for a typical researcher (who might even be you!) 30+ years from now - what will they need to understand what’s inside your data files? The goal is to have enough information for the researcher to understand the data, interpret the data, and then reuse the data in another study.
Another way to think about metadata is to answer the following questions with the documentation:
- What was measured?
- Who measured it?
- When was it measured?
- Where was it measured?
- How was it measured?
- How is the data structured?
- Why was the data collected?
- Who should get credit for this data (researcher AND funding agency)?
- How can this data be reused (licensing)?
The details that will help your data be cited correctly are:
- Global identifier like a digital object identifier (DOI)
- Descriptive title that includes information about the topic, the geographic location, the dates, and if applicable, the scale of the data
- Descriptive abstract that serves as a brief overview off the specific contents and purpose of the data package
- Funding information like the award number and the sponsor
- People and organizations like the creator of the dataset (i.e. who should be cited), the person to contact about the dataset (if different than the creator), and the contributors to the dataset
The details that will help your data be discovered correctly are:
- Geospatial coverage of the data, including the field and laboratory sampling locations, place names and precise coordinates
- Temporal coverage of the data, including when the measurements were made and what time period (ie the calendar time or the geologic time) the measurements apply to
- Taxonomic coverage of the data, including what species were measured and what taxonomy standards and procedures were followed
- Any other contextual information as needed
The details that will help your data be interpreted correctly are:
- Collection methods for both field and laboratory data the full experimental and project design as well as how the data in the dataset fits into the overall project
- Processing methods for both field and laboratory samples
- All sample quality control procedures
- Provenance information to support your analysis and modeling methods
- Information about the hardware and software used to process your data, including the make, model, and version
- Computing quality control procedures like testing or code review
- Everything needs a description: the data model, the data objects (like tables, images, matrices, spatial layers, etc), and the variables all need to be described so that there is no room for misinterpretation.
- Variable information includes the definition of a variable, a standardized unit of measurement, definitions of any coded values (i.e. 0 = not collected), and any missing values (i.e. 999 = NA).
Not only is this information helpful to you and any other researcher in the future using your data, but it is also helpful to search engines. The semantics of your dataset are crucial to ensure your data is both discoverable by others and interoperable (that is, reusable).
For example, if you were to search for the character string “carbon dioxide flux” in a data repository, not all relevant results will be shown due to varying vocabulary conventions (i.e., “CO2 flux” instead of “carbon dioxide flux”) across disciplines — only datasets containing the exact words “carbon dioxide flux” are returned. With correct semantic annotation of the variables, your dataset that includes information about carbon dioxide flux but that calls it CO2 flux WOULD be included in that search.
Correctly assigning a way for your datasets to be cited and reused is the last piece of a complete metadata document. This section sets the scientific rights and expectations for the future on your data, like:
- Citation format to be used when giving credit for the data
- Attribution expectations for the dataset
- Reuse rights, which describe who may use the data and for what purpose
- Redistribution rights, which describe who may copy and redistribute the metadata and the data
- Legal terms and conditions like how the data are licensed for reuse.
So, how does a computer organize all this information? There are a number of metadata standards that make your metadata machine readable and therefore easier for data curators to publish your data.
- Ecological Metadata Language (EML)
- Geospatial Metadata Standards (ISO 19115 and ISO 19139)
- Biological Data Profile (BDP)
- Dublin Core
- Darwin Core
- Preservation Metadata: Implementation Strategies (PREMIS)
- Metadata Encoding Transmission Standard (METS)
Note this is not an exhaustive list.
Many journals require a DOI (a digital object identifier) be assigned to the published data before the paper can be accepted for publication. The reason for that is so that the data can easily be found and easily linked to.
Some data repositories assign a DOI for each dataset you publish on their repository. But, if you need to update the datasets, check the policy of the data repository. Some repositories assign a new DOI after you update the dataset. If this is the case, researchers should cite the exact version of the dataset that they used in their analysis, even if there is a newer version of the dataset available.
Researchers should get in the habit of citing the data that they use (even if it’s their own data!) in each publication that uses that data.
8 Data Sharing & Preservation
8.1 Data Packages
We define a data package as a scientifically useful collection of data and metadata that a researcher wants to preserve.
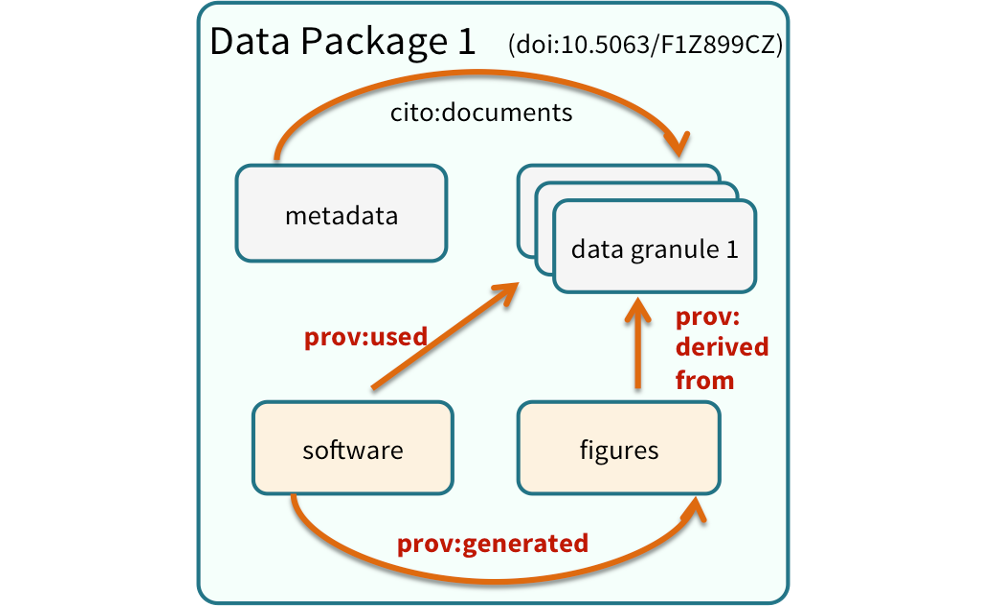
Sometimes a data package represents all of the data from a particular experiment, while at other times it might be all of the data from a grant, or on a topic, or associated with a paper. Whatever the extent, we define a data package as having one or more data files, software files, and other scientific products such as graphs and images, all tied together with a descriptive metadata document.
Many data repositories assign a unique identifier to every version of every data file, similarly to how it works with source code commits in GitHub. Those identifiers usually take one of two forms. A DOI identifier, often assigned to the metadata and becomes a publicly citable identifier for the package. Each of the other files gets a global identifier, often a UUID that is globally unique. This allows to identify a digital entity within a data package.
In the graphic to the side, the package can be cited with the DOI doi:10.5063/F1Z1899CZ,and each of the individual files have their own identifiers as well.
9 Bonus: Load data from Box into R
The boxr package provides a convenient R interface to the Box API, allowing you to read, write, and manage files stored in Box directly from your R environment — no manual downloading required.
Working with Box through the API keeps your workflow reproducible and collaborative. Your R scripts can reference shared Box files directly, making it easy for your team to work from a single source of truth without emailing files or managing local copies.
In this activity, we will see how to:
- Authenticate with the Box API using OAuth2 via
box_auth() - Navigate your Box directory structure with
box_search()andbox_ls() - Read data directly into R using
box_read()for common formats like .csv
In order to access Box from R, you first need to set up an “application” that opens a gateway for you to interact with the Box API, and creates credentials for you. This is an initial setup activity that you will only need to do once.
Step 1: After logging into Box in your web browser, manually go to the Box Developers Console
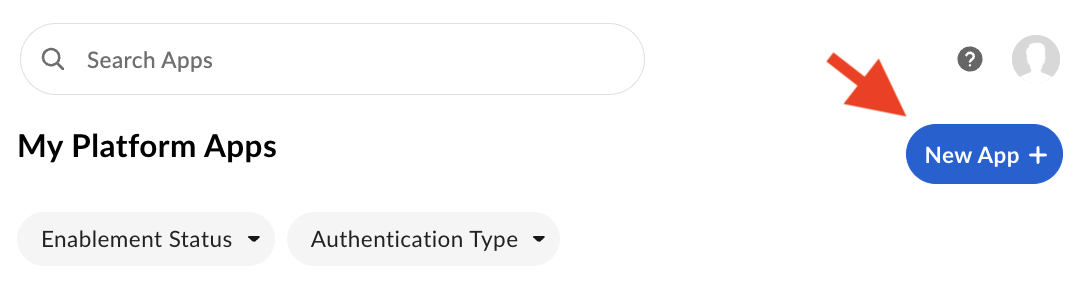
Step 2: Locate and click the New App + button in the upper right to create a new Box API application.
- App Name: Choose whatever you want, e.g. “Boxr”
- App Type: Choose OAuth 2.0
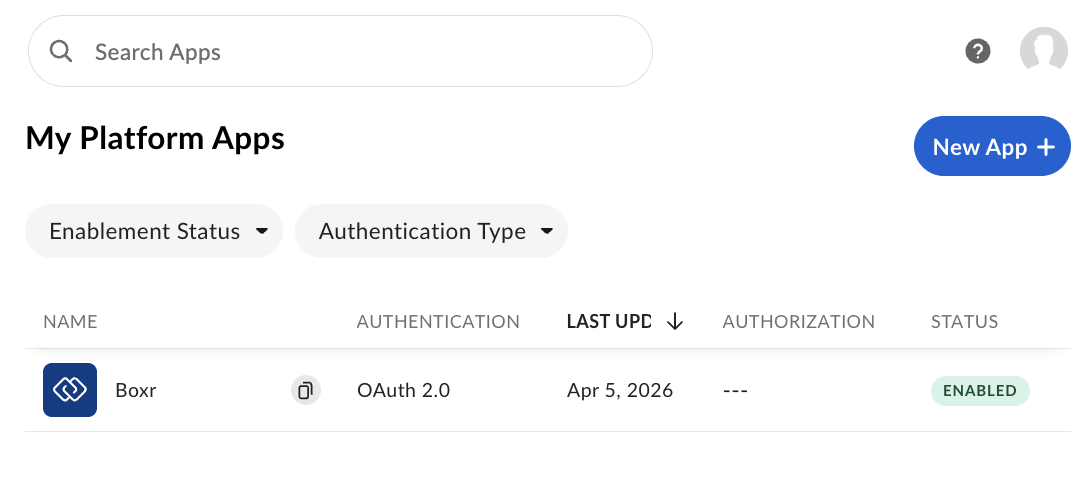
You should now see your application listed in the developer console.
Step 3: Click on the application to open the app settings interface, and select the Configuration tab. Scroll down to the Redirect URI section, and add this address: http://localhost:1410/
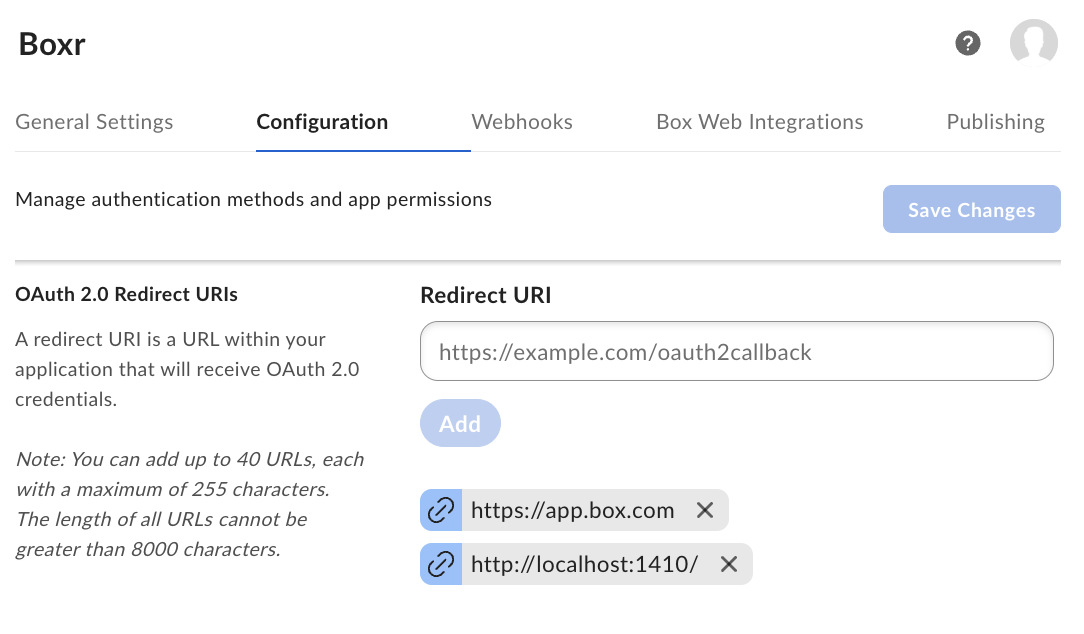
Be sure to click Add and the Save Changes!
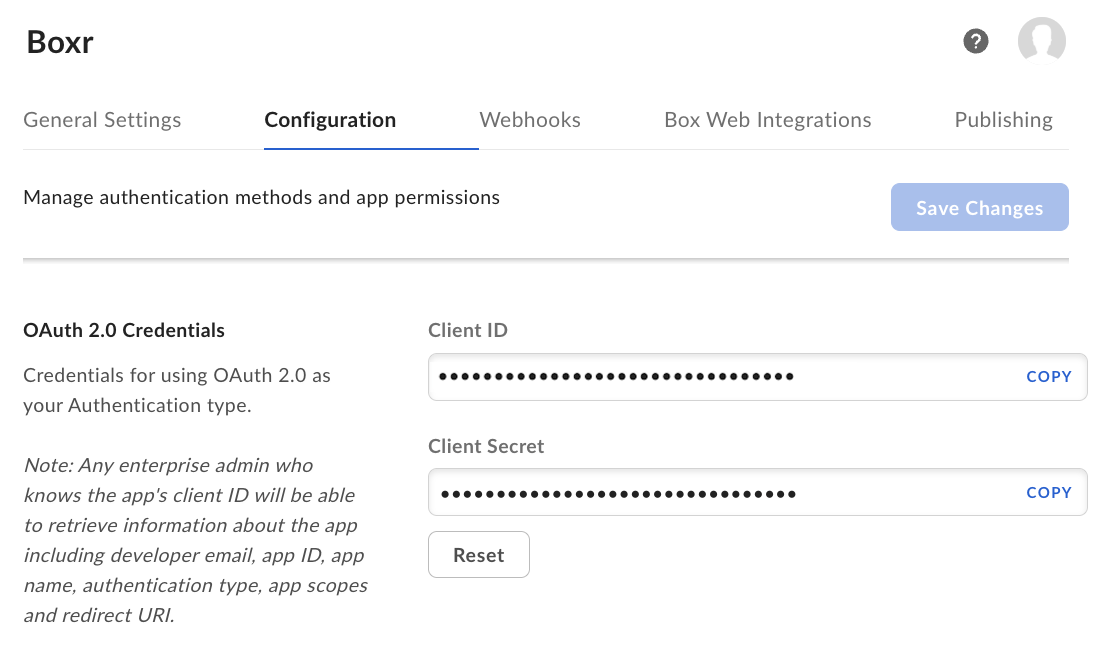
Step 4: Get your credentials! Scroll to the OAuth 2.0 Credentials section in the same Configuration panel to locate your Client ID and Client Secret. We will pass them to R in the next section.
After completing the setup steps above, you can use the boxr package to log into Box, explore your Box workspace, locate a particular CSV file, and read it!
Let’s start out by loading boxr package.
library(boxr)First we need to log in. The first time you do this, it should open a browser for authentication. If successful, you’ll see console output indicating that authentication is complete, and reporting your identity.
> box_auth()
# Using `BOX_CLIENT_ID` from environment
# Using `BOX_CLIENT_SECRET` from environment
# Waiting for authentication in browser...
# Press Esc/Ctrl + C to abort
# Authentication complete.
# boxr: Authenticated using OAuth2 as <Your name>(<Your email address>, id: <Your box ID>)
After authenticating, we can explore our Box workspace. Two key functions are box_ls(), which lists the contents of a folder, and box_search(), which allows you to search for content. In the code sample below, we’ll first search for a folder by name, then list the contents of that folder, then list the contents of a particular sub-folder.
You’ll notice that each code segment follows the same pattern:
- Call a
boxrfunction that sends a request to the Box API and returns a response. - Coerce that response to an R data frame, and display a subset of columns.
Note that we could combine these into one expression rather than separating the code into two steps, but here we keep them separate to make it clearer what’s going on, and also to demonstrate the common API interaction pattern of Send request -> Get response -> Process response.
# Search for the base project folder, and return it as a data frame
> response <- box_search_folders("2026_DELTA_SYNTHESIS_WORKGROUP")
> base_folder <- as.data.frame(response)[c("name", "type", "size", "id")]
#                            name   type     size           id
#  2026_DELTA_SYNTHESIS_WORKGROUP folder 58719301 xxxxxxxxxxxx

# Using the base folder id, list the contents of that folder
> response <- box_ls(base_folder$id)
> as.data.frame(response)[c("name", "type", "size", "id")]
#      name   type     size           id
#  Training folder     3716 375386190471

# List the contents of the 'Training' folder
> response <- box_ls(375386190471)
> as.data.frame(response)[c("name", "type", "size", "id")]
#            name type size            id
#  airquality.csv file 2802 2190747337891
Finally, let’s get some data from Box! The boxr package provides multiple ways of retrieving data – including both downloading files to your computer, and reading data into R. We’ll do the latter here, using the box_read_csv() function that downloads a CSV and reads it into R as a data frame, all in one step.
# Read airquality.csv into R as a data frame
# We'll also pass the `stringsAsFactors` argument to make this match
# the same data frame that was used to create this file in the first place!
> airquality_from_box <- box_read_csv(2190747337891, stringsAsFactors=TRUE)

> identical(airquality, airquality_from_box)
# [1] TRUE