Here we only have two entities, and there is a relationship between them. If we had many entities, not all entities may have a direct relationship (through a primary/foreign key match), so would not be connected by a line.

In our case, entities are plants and sites, since we are gathering observations about both of these. Write each entity in a box of its own.
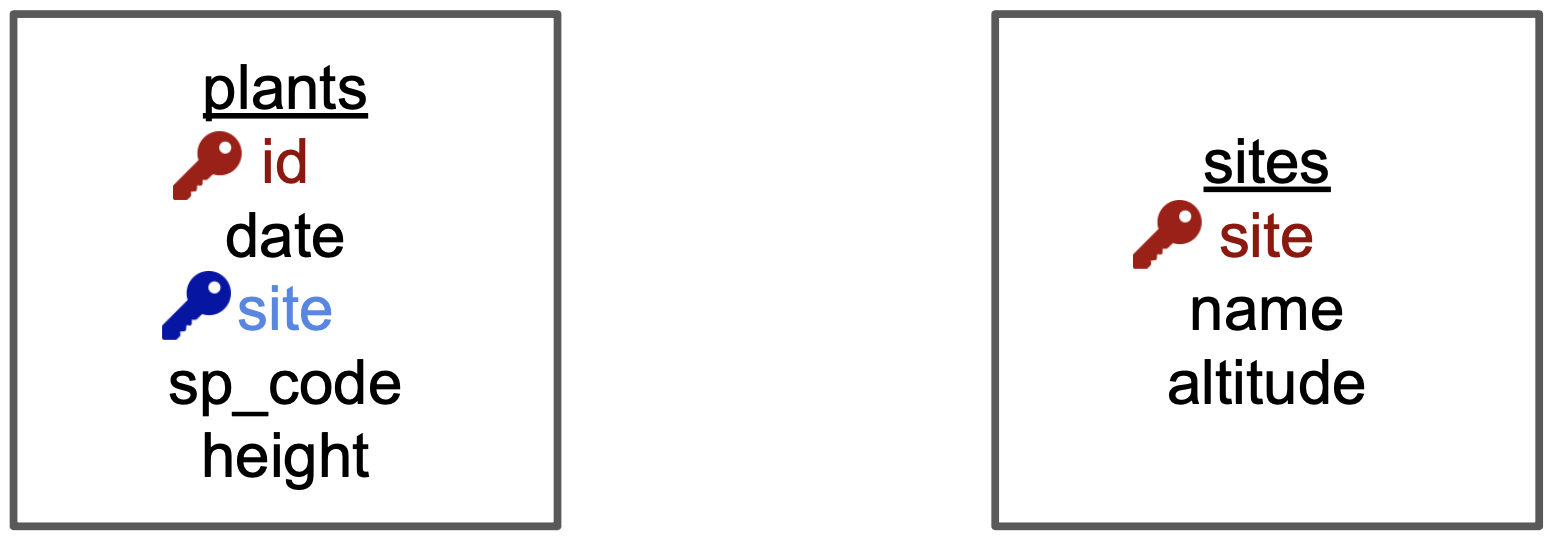
Add the variables as a list of attributes inside each box. Then, identify the primary and foreign keys in each of the boxes. To visualize this, we have indicated
- the primary key (of each entity) in red and
- any foreign keys in blue .
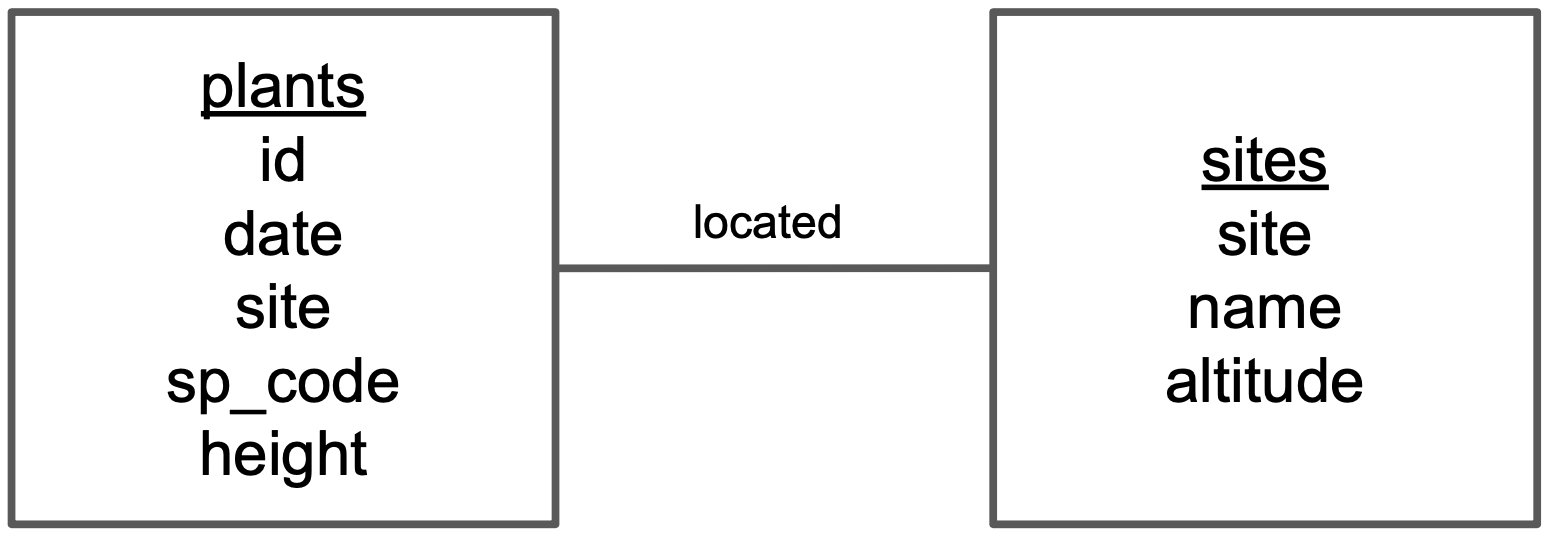
- Draw a line between the boxes of each pair of entities that has a relationship.
- Identify which box has the primary key of the other as a foreign key. Let’s call the box that has the foreign key box1 and the other box box2.
Using the previous diagram we can see that “site” is the primary key of sites and appears as a foreign key in plants. So plants is box1 and sites is box2.
- Add a word describing how box1 is related to box2 above the line connecting the two boxes. So, for example, we need to describe how plants is related to sites.
The relation between plants –> sites is “a plant is located in a site”, so we write “located” above the line indicating the relationship between plants and sites.

Now let’s quantify how many items in an entity are related to another entity. This is easiest if we reuse the description we found in the previous step.
In our description of the relationship of plants –> sites, “a plant is located in one site”. Then we add the symbol for “one” at the end of the line going from plants to sites.
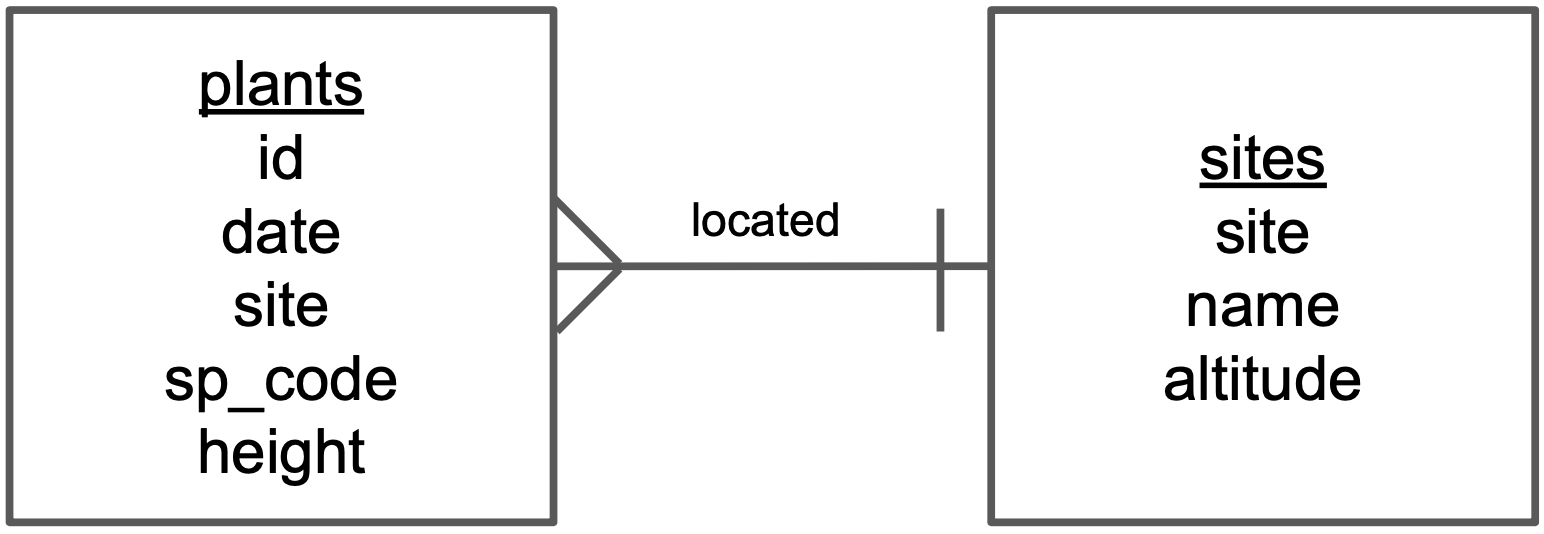
We also need to indicate cardinality in the other direction of the relationship.
Since the relationship between sites –> plants is “a site has many plants”, we add the symbol for “many” at the end of the line going from sites to plants
That’s it!
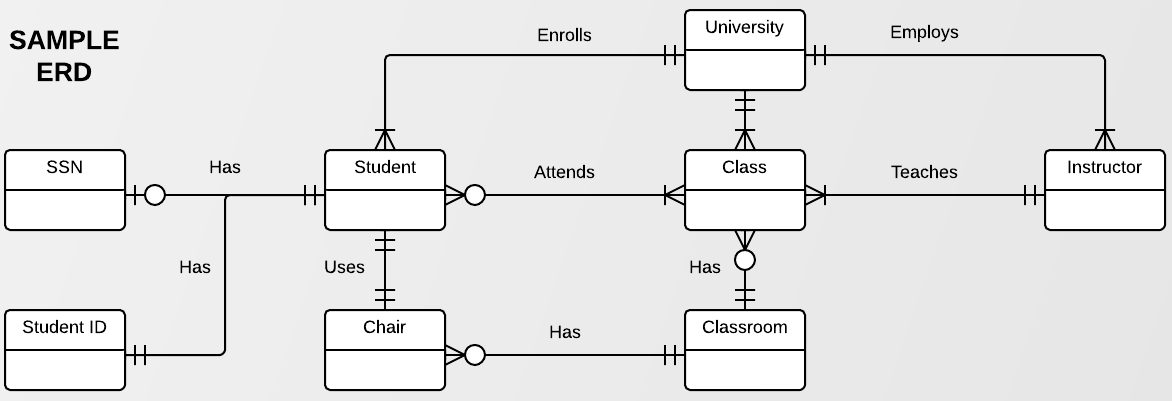
The symbols we used at the end of the lines are called ERD “crow’s foot”. This chart shows all the existing symbols:
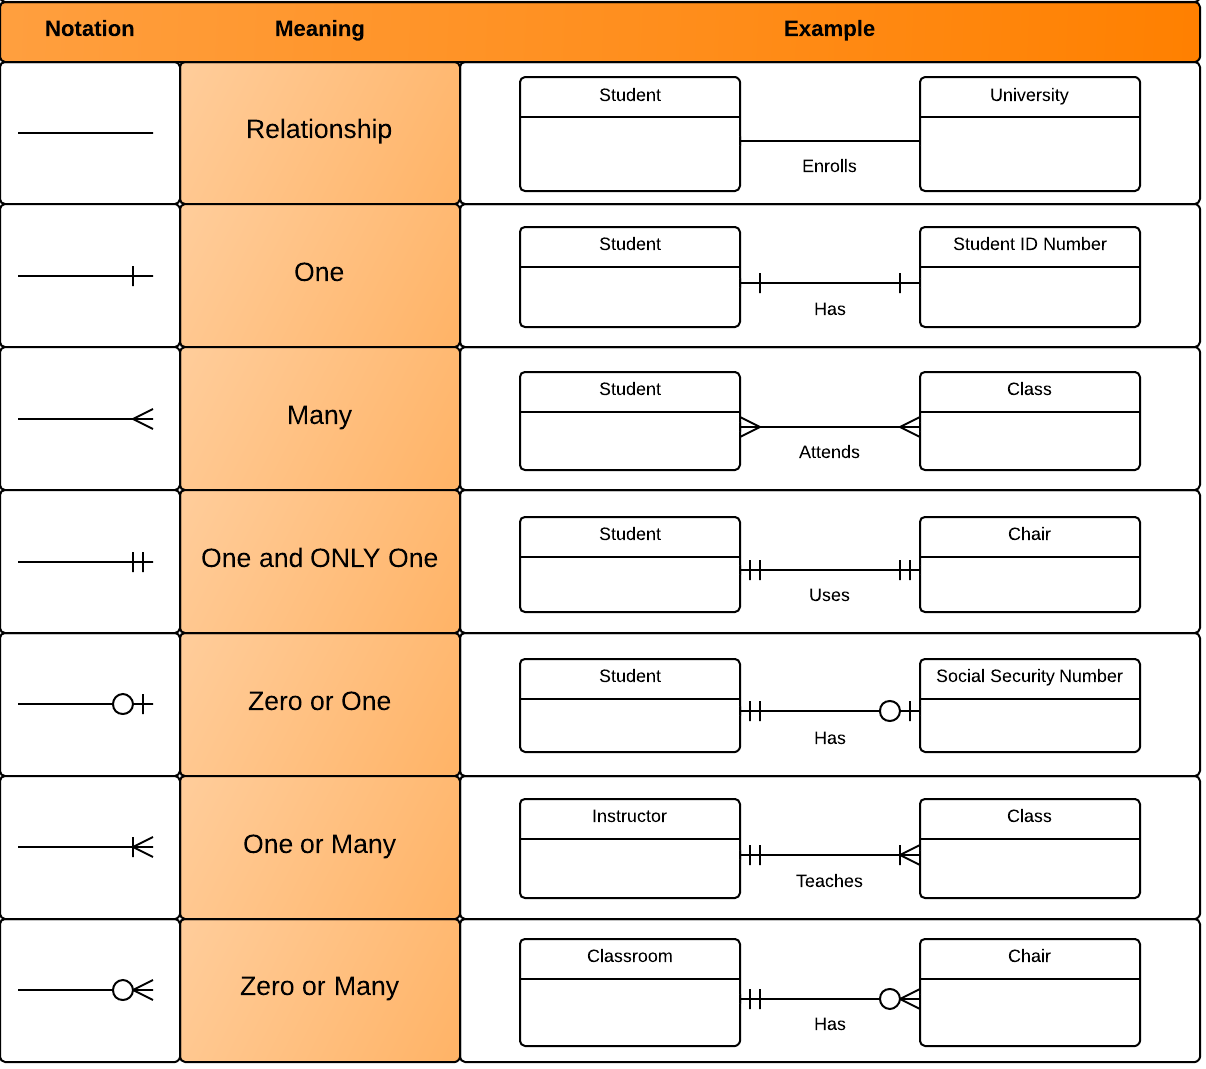
Examine the relationships shown in this chart, including the crows foot symbols. Can you interpret the meaning of each relationship?