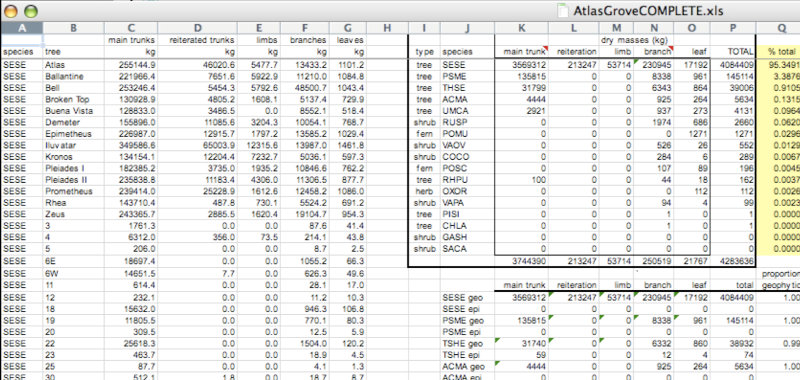
Here is a screenshot of an actual dataset that came across NCEAS.
We have all seen spreadsheets that look like this - whatever this is, it isn’t very tidy. Let’s dive deeper into why we consider it untidy data.
Recognizing Untidy Data
Here is a screenshot of an actual dataset that came across NCEAS.
We have all seen spreadsheets that look like this - whatever this is, it isn’t very tidy. Let’s dive deeper into why we consider it untidy data.
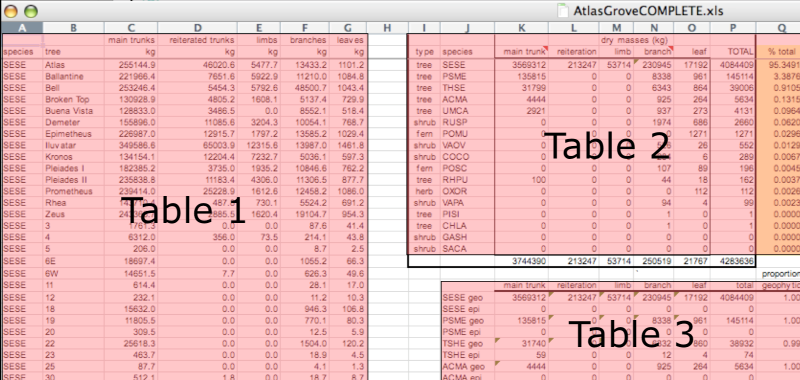
To begin with, notice there are actually three smaller tables within this spreadsheet. Although for our human brain can interpret this easily, it is difficult to get a computer to see it this way.
Having multiple tables within the same spreadsheet will create headaches down the road should you try to read in this information using R or another programming language.
Having multiple tables immediately breaks the tidy data principles, as we will see next.
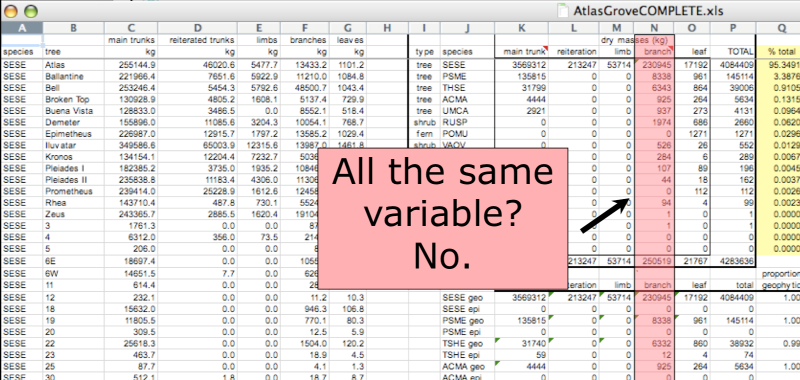
In tidy data, each column corresponds to a single variable. If you look down a column, and see that multiple variables exist in the table, the data is not tidy. A good test for this can be to see if you think the column consists of only one unit type.
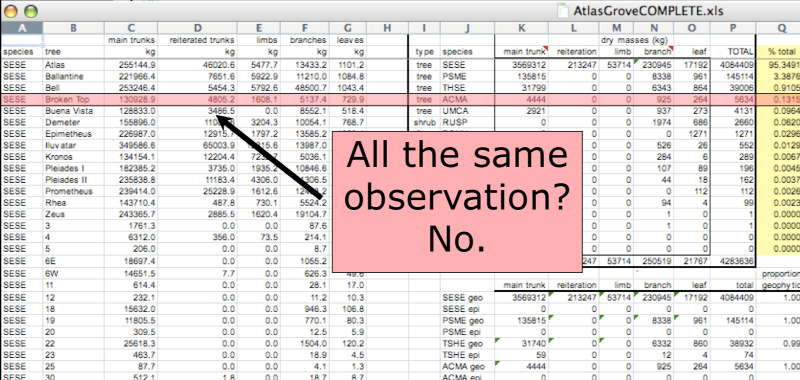
The second principle of tidy data is: every row must be a single observation. If you look across a single row, and you notice that there are clearly multiple observations in one row, the data is not tidy.
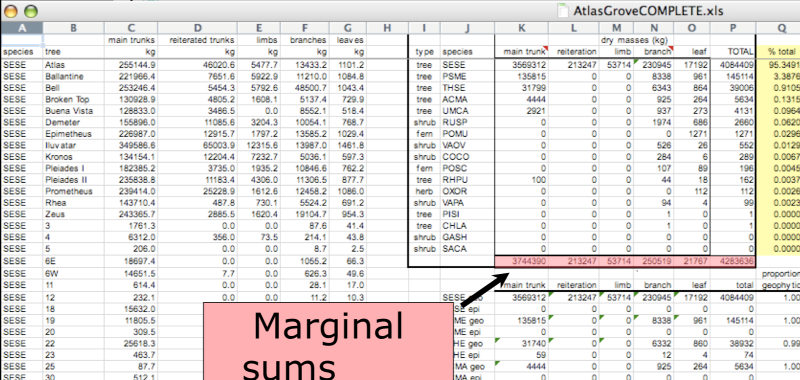
They break principle one, “Every column is a single variable”, because a marginal statistic does not represent the same variable as the values it is summarizing.
They also break principle two, “Every row is a single observation”, because they represent a combination of observations, rather than a single one.
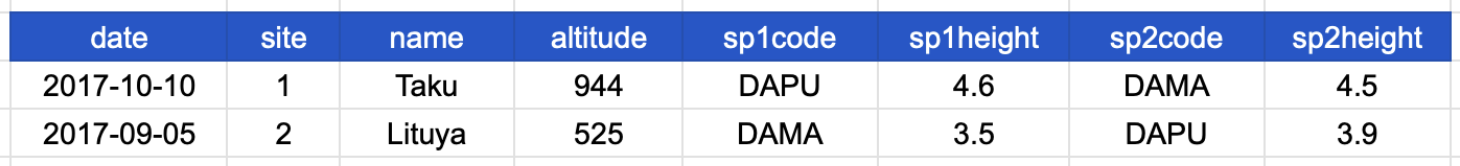
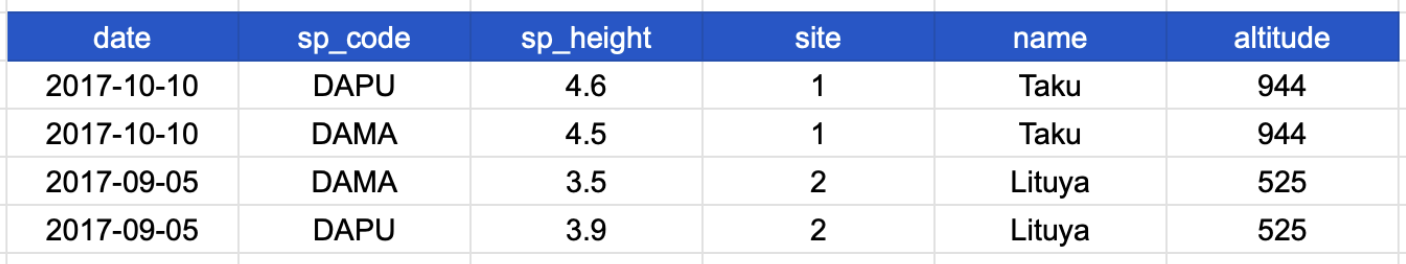
This table shows data about species observed at a specific site and date. The columns represent:
Which tidy data principle(s) does this table break?
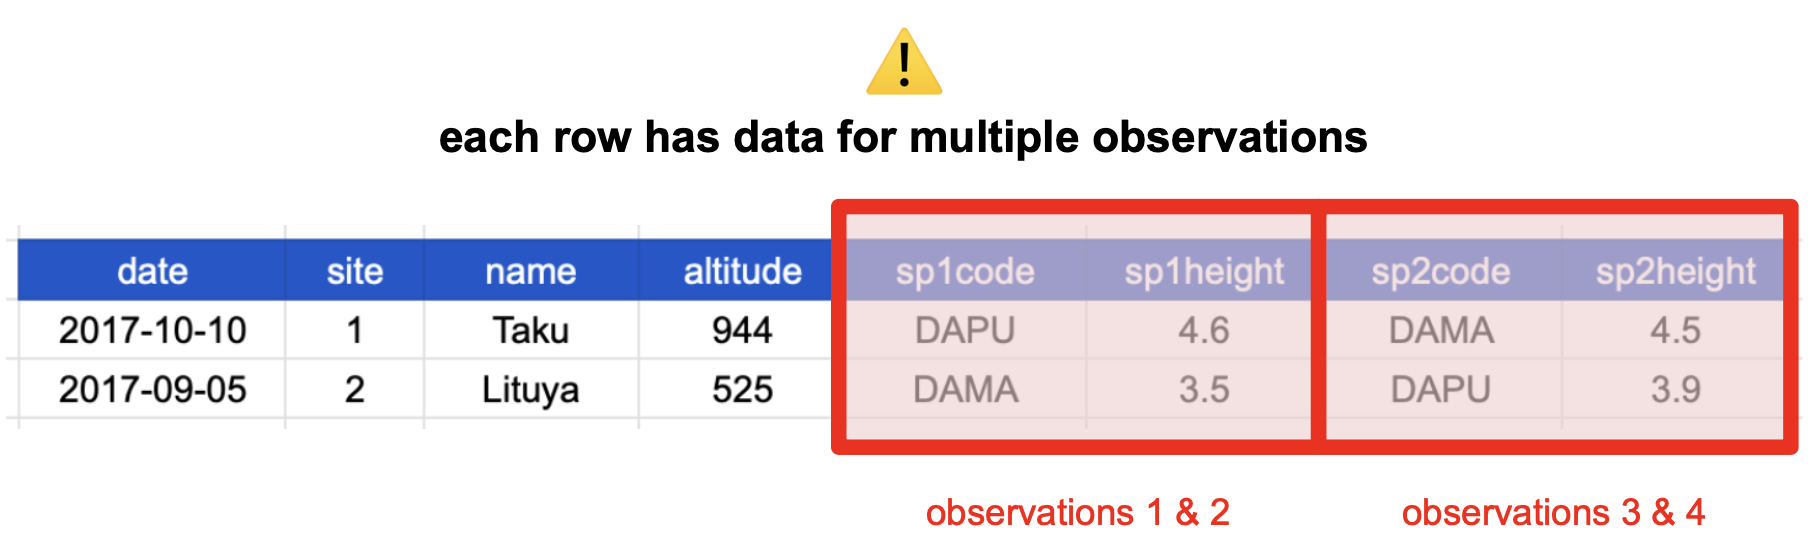
This table breaks the second tidy data principle: “Every row is a single observation.” Remember that an observation is all the values measured for an individual entity.
If our entity is a single observed plant, then the values we measured are date and site of observation, the altitude, and the species code and height.
People often refer to this as “wide format”, because the observations are spread across a wide number of columns. Note that, should one encounter a new species in the survey, we would have to add new columns to the table. This is difficult to analyze, understand, and maintain.
To solve this problem, we can create a single column for species code and a single column for species height. Each observation has been given its own row!